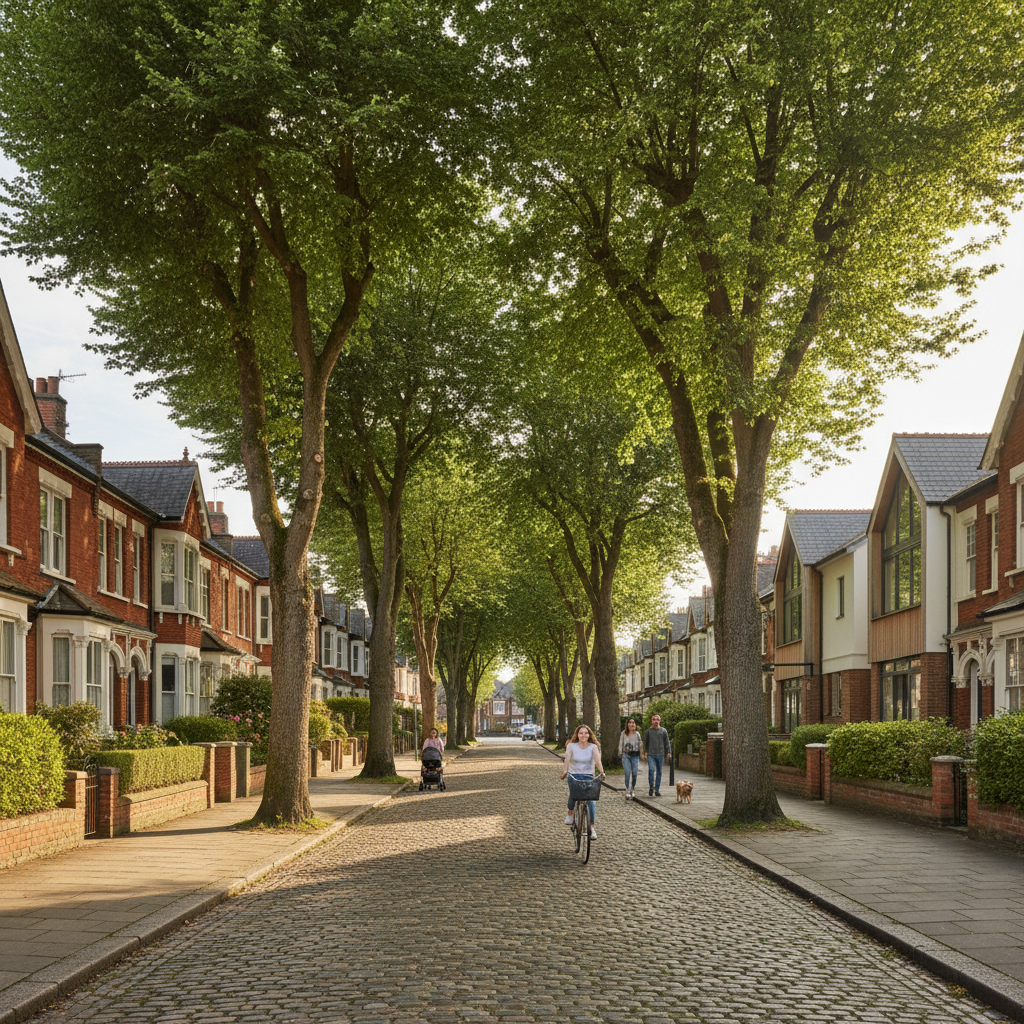
The Tale of Two Tags, TW11 Property Market — May 2026
Imagine for a second that you’re walking through a local car showroom. You see a beautiful car with a sticker in the window for £50,000. But when you look at the receipt of the person who just bought one, they actually paid £40,000. You’d wonder what was going on, wouldn’t you?
That is exactly the curious story unfolding across our TW11 postcode right now. Whether you are grabbing a coffee near Udney Park Road or wandering past the leafy greens of King Edwards Grove, there is a fascinating gap between what people hope to get for their homes and what is actually landing in their bank accounts.
The Price on the Tin vs. The Price in the Pocket Right now, if we look at the 328 homes currently looking for owners across TW11, the average "asking price" (the number you see on the portals) is £788,455. To give you an idea of what that buys you, it’s roughly the cost of a lovely three-bedroom family home in many of our quiet side streets.
However, the "sold price"—the actual money that changed hands over the last year—averages out at £690,465.
Did you know there is a £97,990 gap between those two numbers? In simple terms, what you see on the internet is often about 14% higher than what buyers are actually willing to pay at the front door. It suggests that while sellers are feeling very confident, buyers are being a bit more cautious with their pennies.
Choice, Choice, and More Choice If you’ve been thinking about moving, you’ve picked a great time to be a browser. From the bustling High Streets to the quieter corners of Munster Road, there are currently 289 properties for sale in the TW11 area.
With current market activity levels seeing about 21 sales every month, the existing housing supply is significant. In the world of moving house, we call this a "Buyer’s Market." It’s like a buffet where there’s plenty of food for everyone; because the stock levels are so healthy, there is a high degree of choice for buyers, meaning nobody has to rush or elbow anyone else out of the way to secure a property. For homeowners, this means there is currently more competition for sellers to contend with.
The Seven-Year Itch Let’s look back into the past. Picture yourself in May 2019—seven years ago. If you bought an average home in TW11 back then, you would have paid around £698,405. Today, that same average home is worth about £690,465.
That means, surprisingly, the value has dipped by about £7,940 (or 1.1%) over seven years. While we usually expect houses to shoot up in value like beanstalks, TW11 is currently having a little "rest." However, don’t let that fool you into thinking nothing big is happening. While the average is steady, some specific homes are still reaching incredible heights. We recently saw a stunning spot on Church Road sell for a whopping £3,225,000!
What does this mean for you? If you live in TW11—whether you're in a detached house on Twickenham Road or a flat near the station—the message for May 2026 is all about being realistic.
If you're selling, you might need to be a bit more flexible with your price tag to stand out amongst the current housing supply. If you're buying, you have the upper hand! You can take your time, look at the wide variety of properties currently for sale, and perhaps negotiate a bit of a bargain.
The market isn't a race right now; it’s a calm stroll. And in a beautiful place like ours, a calm stroll is sometimes exactly what we need.
I’m David Hallas, and I’m always happy to chat about what’s happening on your specific street. See you around the neighbourhood!